
Esquema:
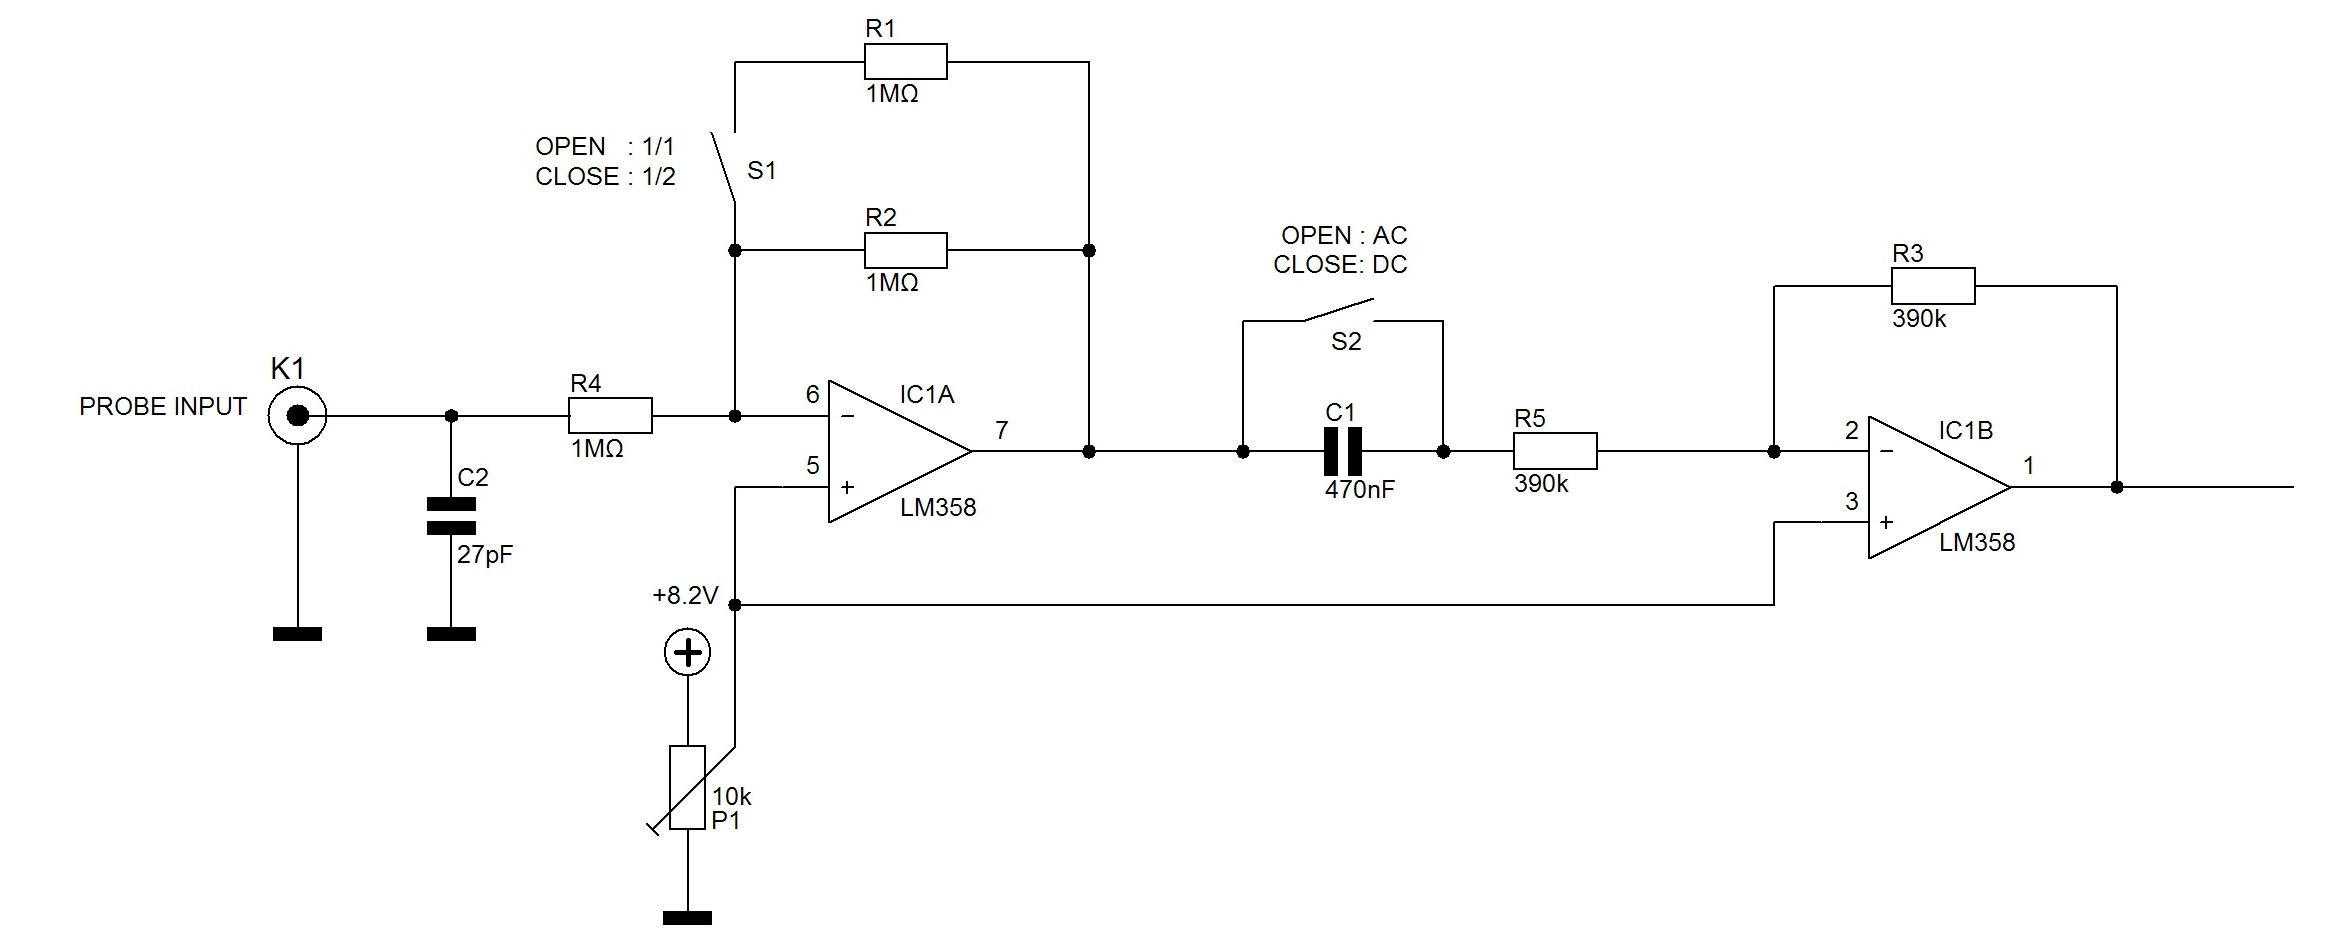
Lista de Material:
Arduino
LM358 IC
Resistências: 3 x 1Mohm
Condensadores: 2 x 0.01 µF
Firmware:
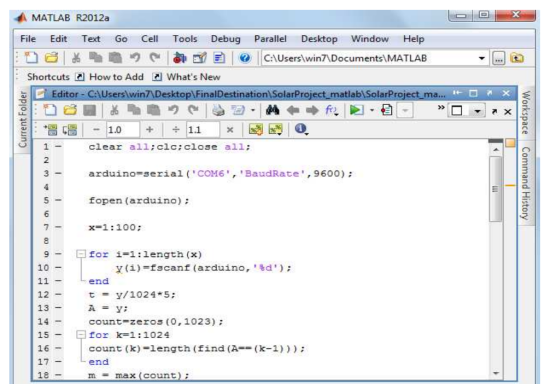
MATLAB CODE FOR SERIAL INPUTTING AND PLOTTING OF WAVEFORM
clear all;clc;close all;

arduino=serial('COM6','BaudRate',9600);

fopen(arduino);

x=1:100;

for i=1:length(x)
    y(i)=fscanf(arduino,'%d');
end
t = y/1024*5;
A = y;
count=zeros(0,1023);
for k=1:1024
count(k)=length(find(A==(k-1)));
end
m = max(count);
in = find(count==m);

fclose(arduino);

disp('making plot..')
figure('Name','The Digital Values From Serial Port');
subplot(2,2,1)
plot(x,y);
title('Serial Port Data');
ylim([0 1023]);
xlabel('From Serial Port');
ylabel('Digital Voltage');


subplot(2,2,2)
plot(x,t);
title('The Analog Plot Of Voltage');
ylim([0 5]);
xlabel('From Serial Port');
ylabel('Analog Voltage');

fprintf('%d is found toh be maximum count of %d ',in-1,m);

subplot(2,2,3)
t = 0:1023;
plot(t,count),title('Frequency Count');
xlabel('Digital Value');
ylabel('No Of Occurences');
xlim([0 1023]);

subplot(2,2,4)
d = count/length(A)*100;
plot(t,d);
title('Digital Values Frequency Percentage');
xlabel('Digital Value');
ylabel('Percentage of No Of Occurences');
xlim([0 1023]);

 Arduino Board codes

void setup() {
  // initialize serial communication at 9600 bits per second:
  Serial.begin(9600);
}

// the loop routine runs over and over again forever:
void loop() {
  // read the input on analog pin 0:
  int sensorValue = analogRead(A0);
  // print out the value you read:
  Serial.println(sensorValue);
  delay(100);        // delay in between reads for stability
}
---------------------
Fonte: www.open-electronics.or
PDF do projecto: DESIGNING-A-PC-OSCILLOSCOPE-USING-FREEDUINO